State Tax Service has launched new dashboard with the tourism tax analytics
Press service of the State Tax Service of Ukraine , published 22 September 2026 at 17:51 Chapter: News
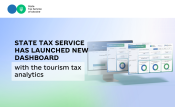
State Tax Service has launched new analytical dashboard “Tourist tax analytics”. It allows not only to see the overall figures of declaration and payment, but also to analyze the tourist tax literally in detail: from Ukraine as a whole to a separate region or territorial community.
Dashboard has been developed by the State Tax Service together with the Fiscal Policy Research Center (FPRC) and the International Renaissance Foundation. This is the third analytical tool with our partners.
The new tool allows to quickly obtain both general picture of Ukraine and detailed information by regions, territorial communities, types of payers and economic activity.
Data covers years 2024 – 2026 and allows to analyze:
- amounts of declared and actually paid tourist tax;
- number of tax agents and accommodation facilities;
- number of days of tourist accommodation;
- tourist tax rates;
- indicators of domestic and inbound tourism;
- distribution of indicators by legal entities and individuals-entrepreneurs.
Data can be compared in dynamics, in particular by quarters, as well as analyzed by regions and territorial communities.
Dashboard has four analytical pages: “Analytics”, “Dynamics”, “Table” and “Map”.
“Analytics” page contains the main summary indicators regarding declaration and the tourist tax payment, number of tax agents, accommodation facilities and days of tourists’ stay.
“Dynamics” – changes in indicators over the time and comparison of volumes of declared tax, actual payment and number of accommodation days by quarter.
“Table” – detailed information by regions and territorial communities, including number of tax agents, indicators of domestic and inbound tourism, tax rates, declared and paid amounts.
“Map” page shows geographical distribution of indicators across Ukraine and ability to compare regions by the amount of paid tourist tax or number of the accommodation days.
And using filters, it is possible quickly select year, region, business entity or type of economic activity. Selected parameters are automatically applied to all indicators and visualizations.
For local governments, the dashboard can be practical source of analytical information to assess tourism revenue, compare community indicators and plan local budget revenues.
For representatives of the tourism industry and the public, open data provides opportunity to assess development of the tourism sector and its impact on the financial resources of territories.
Important: some of the indicators in tax reporting are presented cumulatively from the beginning of year. Therefore, during the analysis, it is necessary to take into account period indicated in the dashboard header.
Previously, the State Tax Service has launched the dashboards “Monitoring of tax revenues of General fund of the State budget” and “Analytics of RRO/PRRO in Ukraine: key indicators”.