State Tax Service launched the analytical dashboard "Single tax of group III"
Press service of the State Tax Service of Ukraine , published 27 October 2026 at 14:07 Chapter: News
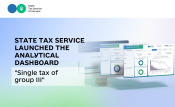
State Tax Service of Ukraine has launched new analytical dashboard “Single tax of group III”. It allows for a comprehensive analysis of data regarding taxpayers and their declared income – from national indicators to the level of individual regions and economic activity types.
This is the fourth dashboard that the State Tax Service has developed together with the Fiscal Policy Research Center (FPRC) and the International Renaissance Foundation.
New tool allows to analyze data for 2024 – 2026 and explore:
- number of single tax payers of group III;
- amounts of declared income by the single tax payers of group III;
- distribution by classifier of the economic activity type;
- distribution of indicators by legal entities and individuals-entrepreneurs.
Users can compare indicators by reporting periods and years, track their dynamics and analyze data by region and industry.
Dashboard includes four pages as standard, each of which helps to explore data from a specific perspective.
"Analytics" – main summary indicators of the total number of the single tax payers of group III, their distribution by the tax rates and declared amount of income.
"Dynamics" – changes in indicators over time. Page allows to compare declared income for reporting periods (I quarter, half-year, three quarters and a year), as well as analyze number of payers.
"Table" – detailed data by regions and economic activity types, in particular number of group III taxpayers, their distribution by the tax rates and amount of declared income.
"Map" – visualization of geographical distribution of indicators across Ukraine, which allows comparing regions by the amount of declared income.
For convenience of use, filters are provided to select reporting year, region, category of business entity or economic activity type.
Previously, the State Tax Service launched dashboards "Monitoring of tax revenues of general fund of the state budget", "Analytics of RRO/PRRO in Ukraine: key indicators" and "Analytics of the tourist tax".