Головна сторінка Державної податкової служби України
 The only state web portal
of electronic services
The only state web portal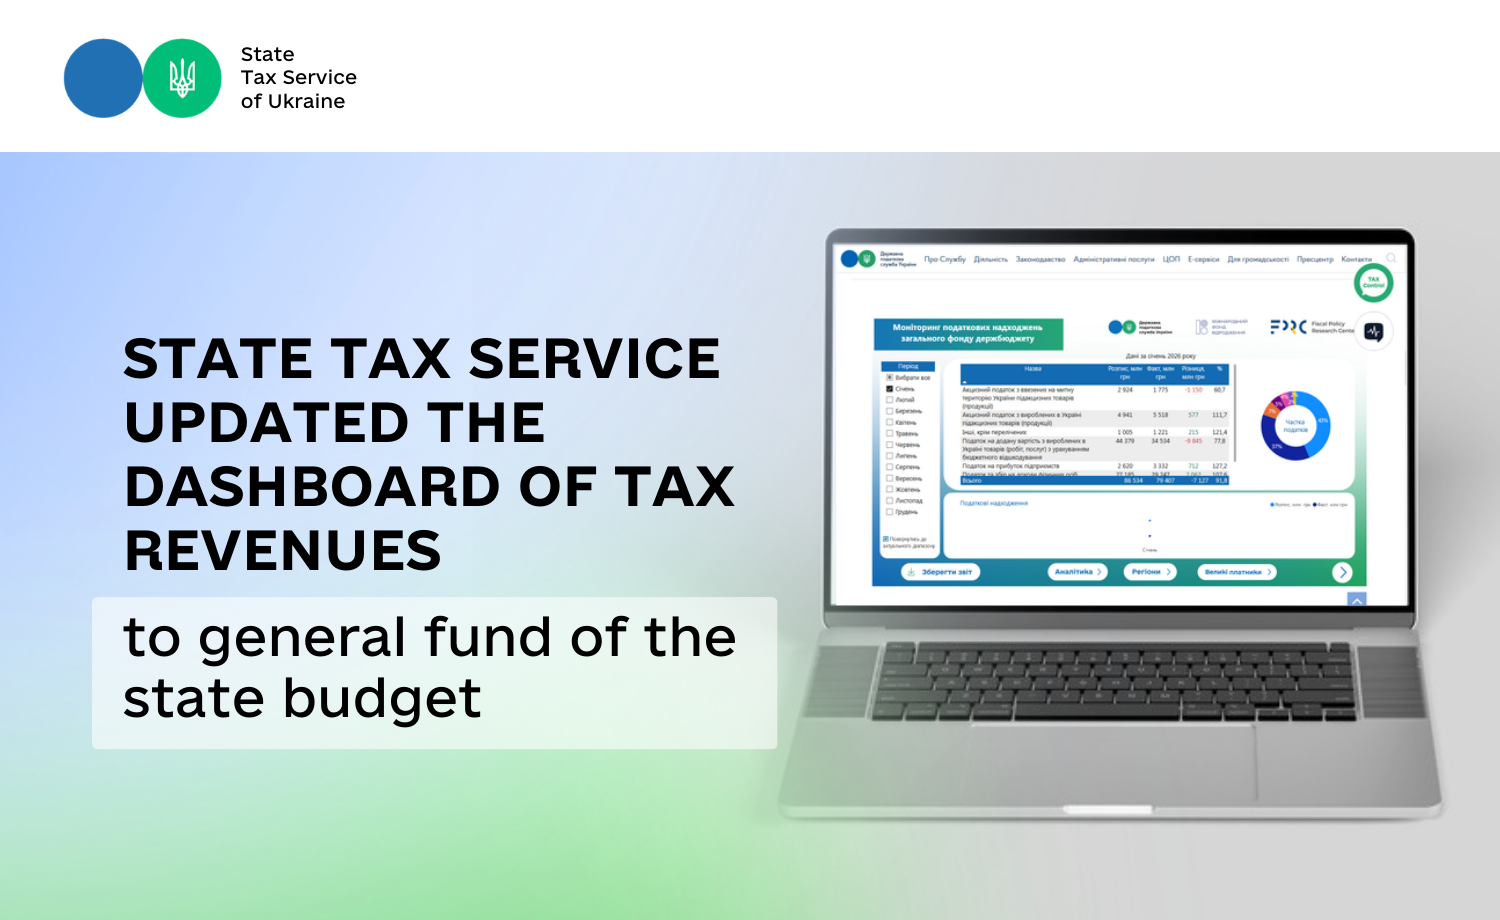
State Tax Service, in partnership with the Fiscal Policy Research Center, updated the dashboard of tax revenues to general fund of the state budget. This was informed by acting Head of the State Tax Service Lesya Karnaukh on the Facebook page.
Modern tool is on the web portal https://tax.gov.ua/. It contains a complete picture of revenue execution and was introduced a few months ago.
“Together, we strive to make numbers as understandable as possible for everyone. So that everyone can see what the country’s revenues actually consist of. Tax Service today is not just about administration. It’s about service, openness and clarity of data. Forget about complex tables and a large array of files” – Lesya Karnaukh stated.
Dashboard is interactive. In order to see the full picture of revenue part execution of the budget, it is only needed to select a month and make a few clicks.
At the first level:
- plan;
- actual revenues;
- deviations;
- taxes that form basis of the budget;
- for which taxes is there an over-fulfillment and for which there is a backlog;
- circle chart of revenue structure – to understand which tax forms the biggest share of the budget;
- dynamics chart – to assess changes over the time.
Further levels:
- it is possible to switch to a specific tax;
- analyze its components;
- see dynamics over the years.
One more level is regional contribution:
- distribution of revenues by the region;
- detailing possibility.
Another one is contribution of the large payers.
A separate page with analysis of the interregional departments and structure of their revenues.
“Such analytics allow us to quickly see tendencies and respond promptly to risks. We are building modern and digital tax system” – Lesya Karnaukh emphasized.